
Budgets vs Actuals
- The report compares an accounting budget with the actual amounts of the Statement of Profit or Loss and, optionally, the Statement of Financial Position.
- It compares a sales budget with the posted revenue, line by line.
- The period runs from the first month of the budget to the month selected in Month To (for example, year to date).
- The budgets are created in Budgets.
The Budgets vs Actuals module must be added to a Menu Group, and users need View access to it in User Access (see How to Add Budgets to a Menu and Set User Access).
Buttons Explained
| Button | Description |
|---|---|
| Arrows (left of the caption and at the right of the button row) | Move the module between the panels:
|
| Expand / Collapse | Open or close all the sections and groups. Your choice is kept when you click View (button) again or change the view. Appears only in the Profit/Loss, Monthly and Financial Position views of an accounting budget. |
| View | Shows the selected view for the selected filters. The message “Please select a Budget.” appears if no budget is selected. |
| Arrow on View button > Reset Data Filter | Resets the filters to their defaults (see Filters Explained), clears any column filters and hides the search box until you click View (button) again. |
| Output |
|
| Menu | Views (the views for the selected budget type; the current view is checked):
Settings Layout (the layout of the sales budget grid) |
Filters Explained
- When the report opens, it selects the default accounting budget of the current financial year (or the budget with the latest start month), with Month To set to the current month of the budget year (or the last month, if the year is over or has not started).
- When you change a filter, the view is cleared until you click View (button) or press Enter. The blue filter bar shows the budget, the period and the entity.
| Filter | Description |
|---|---|
| Budget | Select the budget. Each budget appears with its start month and version, for example, Budget 2026 (Mar 2026, Original). Sales budgets start with “Sales:”. The views on the Menu button change with the budget type. If the current view does not apply to the budget, its main view is used (Profit/Loss for an accounting budget, Sales by Tier for a sales budget). |
| Month To | Select the last month of the period. The list shows the 12 months of the budget year (for example, Mar 2026 to Feb 2027). The period runs from the first month of the budget to this month. |
| Entity | Select the entity for the actual amounts, or All. It is set to the budget’s entity when you select a budget. Hidden if there is only one registered entity. |
Fields Explained
- The search box above the view appears only when the view has data (see Grid Search Bar).
- Section, group and summary rows (for example, Net Profit) appear in bold.
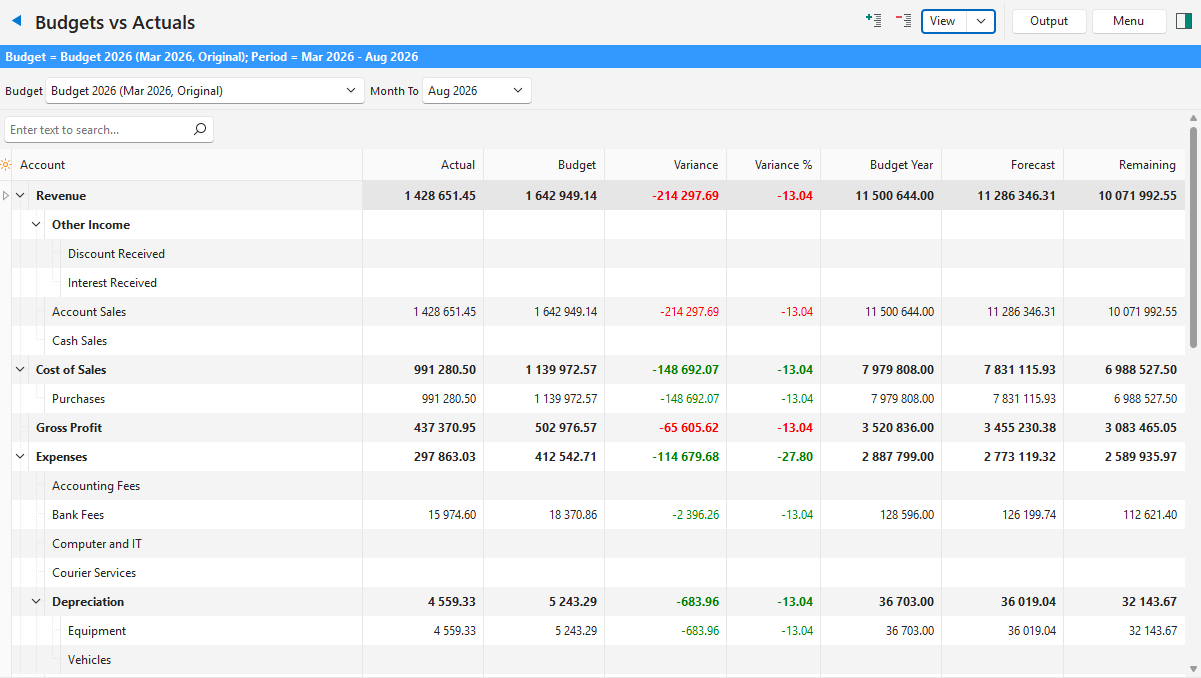
Profit/Loss View
The Variance and Variance % are green when they are favourable (revenue or Net Profit at or above budget, expenses at or below budget) and red when they are unfavourable.
| Field | Description |
|---|---|
| Field Chooser (*) | Add or remove columns. |
| Account | The section, group, account or summary row of the Statement of Profit or Loss. |
| Code | The account code. |
| Actual | The actual amount for the period. |
| Budget | The budget amount for the period. |
| Variance | The actual amount less the budget amount. |
| Variance % | The variance as a percentage of the budget amount. |
| Budget Year | The budget amount for the full 12 months. |
| Forecast | The actual amount for the period plus the budget amounts of the remaining months of the year. |
| Remaining | The budget for the year less the actual amount for the period. |
Monthly View
- Only the months up to Month To appear. To show a later month, add its band again from the band header’s customisation: it appears in grey, with the budget amounts only.
- For a sales budget, this view shows the budget lines (see Sales by Tier View) with the same month bands.
| Field | Description |
|---|---|
| Account (Tier 1 and Tier 2 for a sales budget) | The account or the budget line. |
| Month bands (for example, Mar ’26) | A band for each month, with two columns:
|
| Total | The totals for the period:
|
Financial Position View
Available only for accounting budgets when the General Setting Accounting > Budget - Enable Financial Position is checked. The variances have no green or red colours.
| Field | Description |
|---|---|
| Field Chooser (*) | Add or remove columns. |
| Account | The section, group, account or summary row of the Statement of Financial Position. |
| Code | The account code. |
| Actual Balance | The actual balance at the end of the Month To. |
| Budget Balance | The budgeted balance at the end of the Month To. |
| Variance | The actual balance less the budgeted balance. |
| Variance % | The variance as a percentage of the budgeted balance. |
| Budget Year End | The budgeted balance at the end of the year. |
Sales by Tier View
- The actual amount is the posted revenue (credits less debits) on all the revenue accounts in the budget year, for the selected entity.
- Each sale counts once, against the first line (in the budget’s line order) that it matches, and only on that line’s Revenue Account if the line has one.
- A customer matches a Customer Category line if it is in that category. An item matches an Item Category line if it is in that category or one of its subcategories.
- A Sales Rep line matches the rep on the transaction. A Branch line matches the entity selected on the transaction.
- Sales that match no line appear on the line Unbudgeted / Other.
- The Variance and Variance % are green when the actual amount is at or above budget and red when it is below.
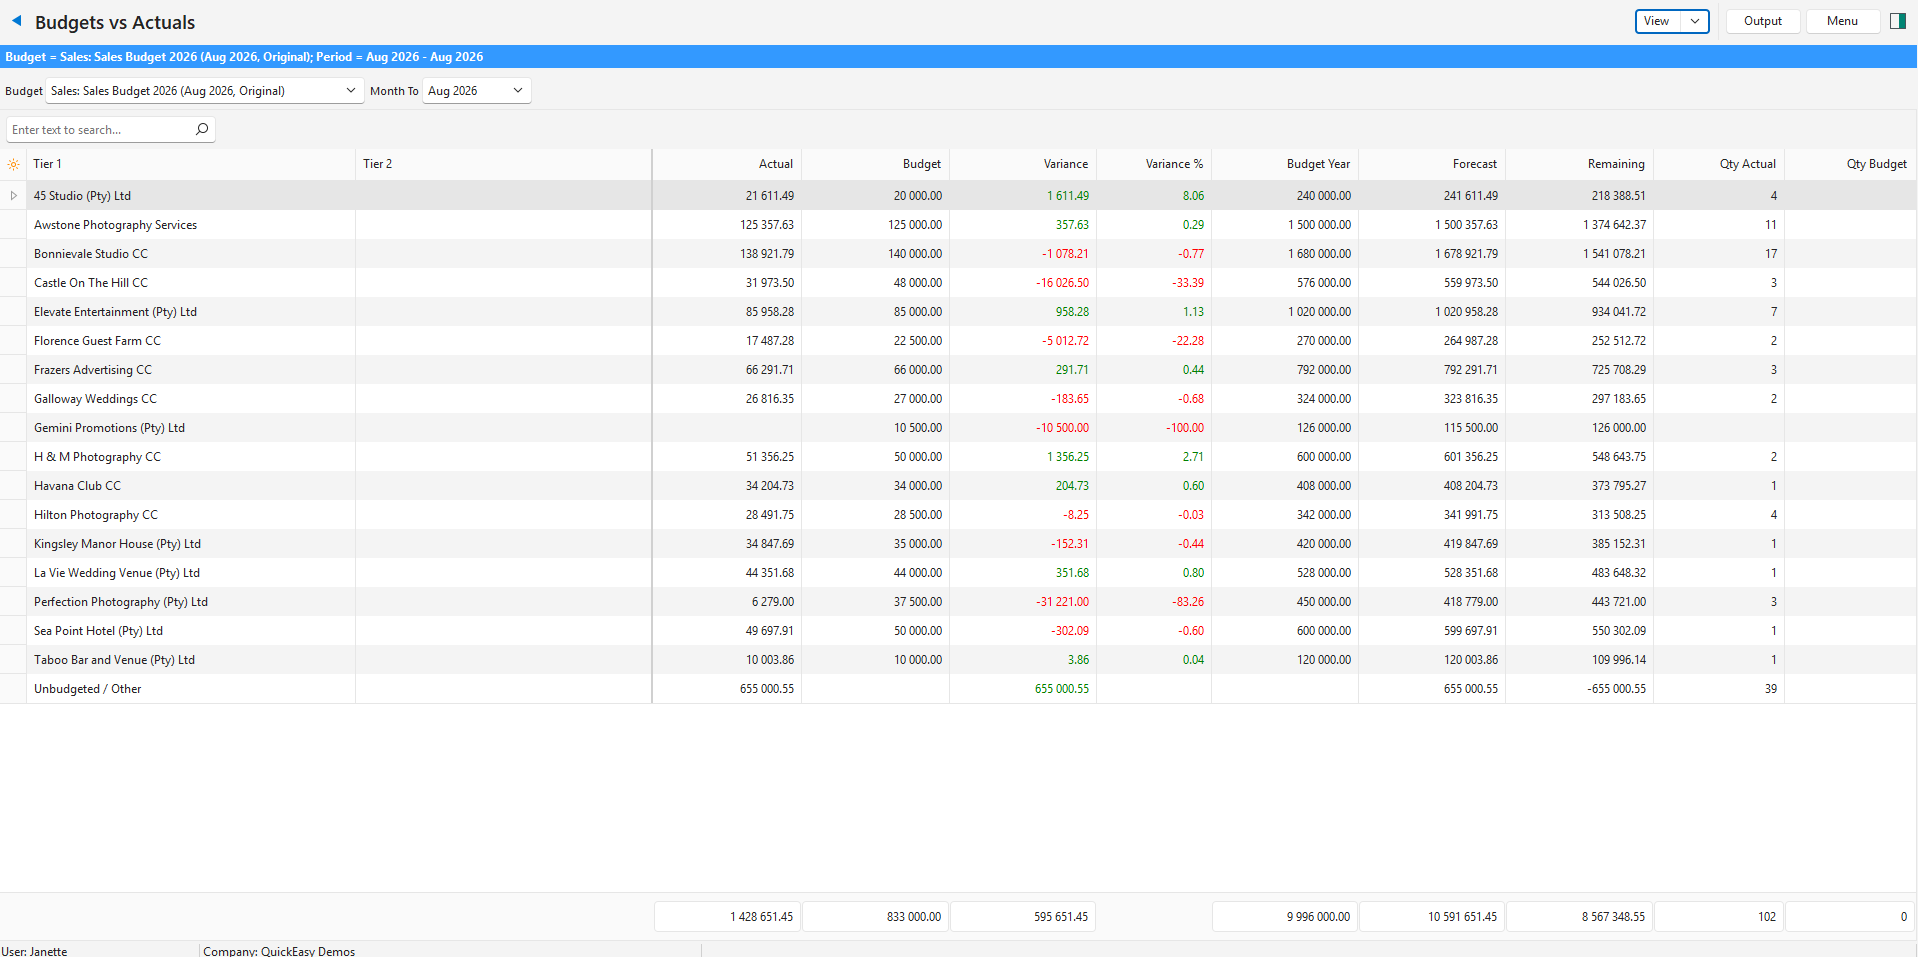
| Field | Description |
|---|---|
| Field Chooser (*) | Add or remove columns. |
| Tier 1 | The line’s value of Tier 1 (for example, the customer category). |
| Tier 2 | The line’s value of Tier 2, if the budget uses two tiers. |
| Actual | The actual revenue for the period. |
| Budget | The budget amount for the period. |
| Variance | The actual revenue less the budget amount. |
| Variance % | The variance as a percentage of the budget amount. |
| Budget Year | The budget amount for the full 12 months. |
| Forecast | The actual revenue for the period plus the budget amounts of the remaining months. |
| Remaining | The budget for the year less the actual revenue for the period. |
| Qty Actual | The quantity sold in the period. |
| Qty Budget | The budgeted quantity for the period. |
Chart View
- For an accounting budget, the chart shows the row selected in the Profit/Loss, Monthly or Financial Position view. Select the row there first, then select Chart. Its name appears above the chart.
- For a sales budget, the chart shows the total of all the lines (“All lines”).
| Field | Description |
|---|---|
| Months | The 12 months of the budget year (for example, Mar 26). |
| Actual | The actual amount of each month, up to the Month To. |
| Budget | The budget amount of each month, for all 12 months. |